Impedance matching is an engineering procedure employed in
circuit design for matching unequal source and load impedances.
Impedance matching is required in order to optimize the power
delivered to the load from the source. Impedance matching is
accomplished by inserting matching networks into a circuit
between the source and the load. A simple example might involve
matching unequal source and load resistances with an
inductance(L)-capacitance(C) circuit, or perhaps optimizing the
gain of an amplifier. In this model, Smith Charts are used to
visualize the interactive process of impedance matching.
 Using
this interactive impedance matching model, you can experience
using a Smith Chart and s-parameters to optimize transmitted
power in simple circuits. Simple series/shunt,
inductance/capacitance matching networks are used, and you can
interactively adjust the values of corresponding L and C
components. Adjusting the matching network components changes
the reflectance of the overall circuit. The reflectance of each
part of the circuit is indicated on the Smith Chart as a red Using
this interactive impedance matching model, you can experience
using a Smith Chart and s-parameters to optimize transmitted
power in simple circuits. Simple series/shunt,
inductance/capacitance matching networks are used, and you can
interactively adjust the values of corresponding L and C
components. Adjusting the matching network components changes
the reflectance of the overall circuit. The reflectance of each
part of the circuit is indicated on the Smith Chart as a red
 or
blue or
blue  ball.
ball.
As you adjust the sliders and modify the component values,
the model calculates new values for the circuit reflectance and
moves the red  and blue
  balls on the Smith Chart. The goal of each excercise is to move
the reflectance point from the center of the Smith Chart, which
represents either the load or source, into the appropriate
  red and
  blue colored rings which represent
the desired matching condition. You can select three different
impedance matching problems of increasing difficulty by clicking
on one of the three labeled tabs included in the model.
Description of Exercises
 The
first exercise lets you experience using the Smith Chart to
perform basic impedance matching between a resistive source and
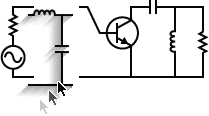
a resistive load. A simple series-inductance shunt-capacitance
network is used to match the 50 ohm source to the 300 ohm load. The
first exercise lets you experience using the Smith Chart to
perform basic impedance matching between a resistive source and
a resistive load. A simple series-inductance shunt-capacitance
network is used to match the 50 ohm source to the 300 ohm load.  The source reflectance of the circuit looking from the load
toward the source is represented by the red
ball
  ,
while the 300 ohm load is indicated by the stationary ,
while the 300 ohm load is indicated by the stationary  red ring .
The objective of the exercise is to interactively match these
two impedances by adjusting the L and C sliders. The model will
provide graphical feedback by moving the red
ball indicating circuit reflectance on the Smith Chart. Adjust
the series L and shunt C sliders to move the reflectance point
from the center of the Smith Chart to the matching impedance
position inside the red ring.
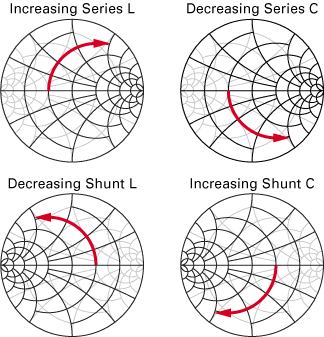
You can study the Smith Chart Circuit Element Paths below for
hints on how different circuit elements change circuit
reflectance on the Smith Chart.
Smith Chart Circuit Element Paths
 The
second exercise provides the impedance matching experience of
optimizing the transducer power gain of a transistor amplifier. The
second exercise provides the impedance matching experience of
optimizing the transducer power gain of a transistor amplifier.  Matching the 50 ohm source to the input reflectance of the
transistor, s*11, and matching the 50 ohm load to the
output reflectance of the transisitor, s*22,
optimizes the power delivered from the source, through the
transisitor, to the load. You are required to match both the
input red ball
  and output blue ball
  of the transistor separately. Adjust the component values to
move both reflectance points to their proper positions within
the
  red
and red
and  blue
rings. blue
rings.
 The
third part of the interactive impedance matching model is a
collection of exercises involving a modular circuit. You begin
by constructing a circuit with either one or two modular
drag-and-drop matching network components. Once the matching
networks have been added to the circuit, the sliders will become
active and allow you to adjust the component values. The
third part of the interactive impedance matching model is a
collection of exercises involving a modular circuit. You begin
by constructing a circuit with either one or two modular
drag-and-drop matching network components. Once the matching
networks have been added to the circuit, the sliders will become
active and allow you to adjust the component values.  Then you will engage in impedance matching for the circuit you
have just created! There are 8 different circuits you can
construct and there are 5 different value pairs for s*11
and s*22 on the Smith Chart, altogether 40 impedance
matching exercises. You will find that not all matching
networks will work! For some of the circuits you will be
able to constuct, you will not be able to position the red
ball
  within the red ring or the
  blue ball within the blue
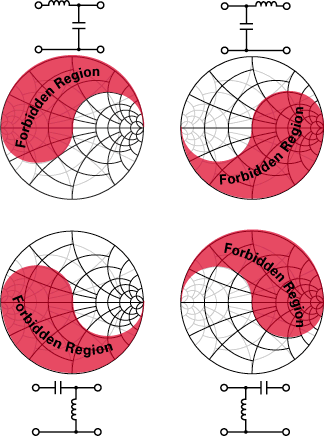
ring. To determine in advance which matching networks
will work, take a close look at the Forbidden Regions of the
Smith Chart below. There are 5 different location pairs for s*11
and s*22 corresponding to different frequencies that
can be matched. Use the frequency indicator to select an
operating frequency, and then drag-and-drop appropriate matching
networks into the circuit and adjust the component values to
move both reflectance points to their proper positions within
the
  red
and red
and  blue
rings. blue
rings.
Forbidden Regions of the Smith Chart
Smith Chart Circuit Elements Paths
The graphs below demonstrate how the various shunt and series L
and C components change the circuit reflectance on the Smith
Chart. Assuming the given component is the last component in the
matching network, the circuit reflectance will move as indicated
along constant resistance or constant conductance circles.
You can think of impedance matching using the Smith Chart as
driving a car to a specific destination in Smith Town - a city
were none of the streets are straight! By adjusting circuit
components in appropriate order, we can constrain the circuit
reflectance to paths along constant resistance or constant
conductance circles. Just like road signs can direct a car along
the circular streets of Smith Town, so can we reach the matching
impedance condition in a straightforward and deterministic way.

Forbidden Regions of the Smith Chart
For a given load reflectance, only certain L-C matching networks
will be capable of transforming the source impedance to the load
impedance. In fact, for any load reflectance, exactly two of the
four possible L-C matching networks in the Transistor
Amplifier-II model above will be able to do the matching
job. But which two?
The charts below can be used to determine which matching
networks will work in a given load situation. If the load
reflectance lies within the forbidden region of the Smith Chart
for the indicated matching network, then that network cannot
perform the required matching operation. You cannot drive
your car into the forbidden neighborhoods of Smith Town! They
are unpaved!
Use these charts to determine which matching network should
be used. First, visually locate the position of the load
reflectance from the Transistor Amplifier-II model above
on each of the four color Smith Charts below. Then, eliminate
the two networks whose forbidden regions overlap the reflectance
point, and use one of the remaining two networks to perform the
impedance match.

|
![]()
![]()